Subject Line
How to automate the pivot table in different reports?
Overview
As we know Pivot tables are used to Summarize, Sort, Reorganize, and Group, Count, Total or Average data. But sometimes we many need to make copies of the pivot table for each unique item in a field. This will help us to save lot of time with our everyday work as the pivot table can be created instantly
Sometimes we need to make an exact copy of pivot table for each unique item in a field.
Working
Lets understand the feature with an example.
The table below shows Sales of laptops for different countries for the year 2017 & 2018 for different quarters. (Figure 1: Sales of laptops)
There are four countries (Korea, Spain, Netherlands and Korea) and each have multiple records.
The management wants to see the Sales of each country as a separate report.
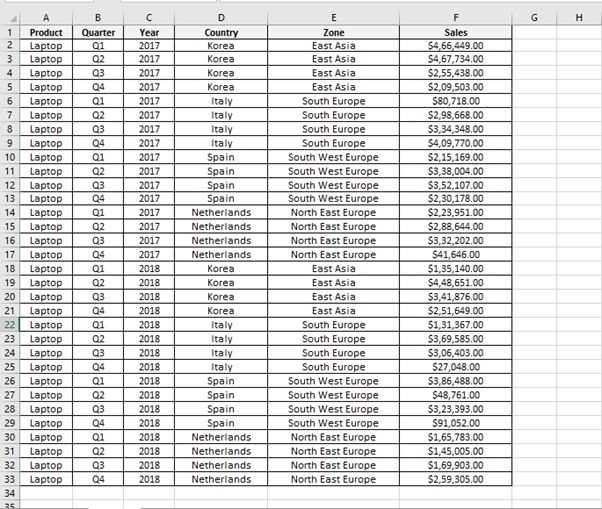
Figure1: Sales of laptops
First create pivot table for Country wise Quarter wise Sales
Step 1: Select the SalesTable (A1:F33).
Step 2: Go to INSERT tab and click on PivotTable in Tables grouping.
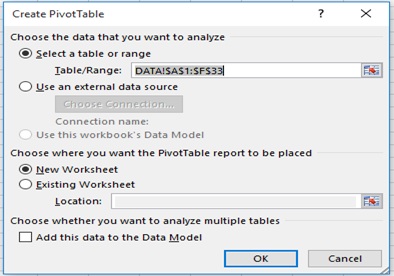
Step 3: Create PivotTable Dialog Box will appear.
Click on OK so that PivotTable is placed in the New Worksheet
Tip: You can also use shortcut keys. Press Alt + D. Then press P and then press F
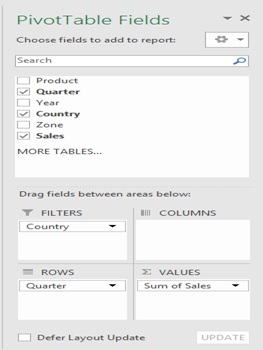
Step 4: Drag the Quarter Field in ROWS area.
Step 5: Drag the Sales to VALUES area.
Step 6: Drag the Country to FILTERS area.
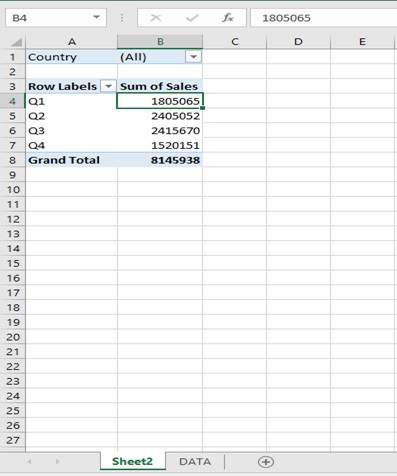
Step 7: Result of the Pivot table
Step 8: We could create pivot table 4 times for each country or else follow the below steps to create instantly.
Step 9: Click on any cell in the Pivot Table.
Step 10: Go to Analyze tab.
Step 11: Click on Options button in Pivot table tab.
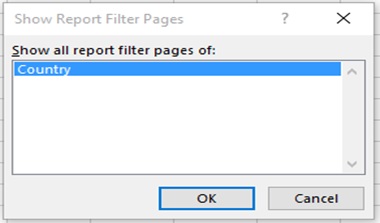
Step 12: Click on Show Report Filter Pages Button
Step 13: Show Report Filter Pages Dialog box appears.
Step 14: Select Country
Step 15: Click on OK
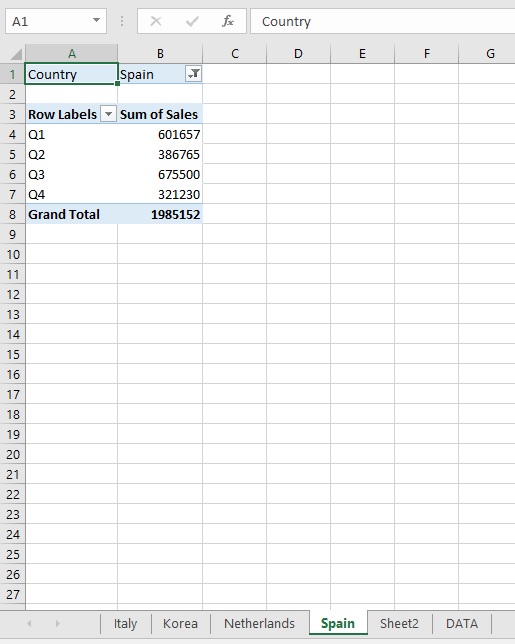
Step 16: We can now see 4 extra tabs i.e. 4 Country (Italy, Korea, Spain, Netherlands)
![]()
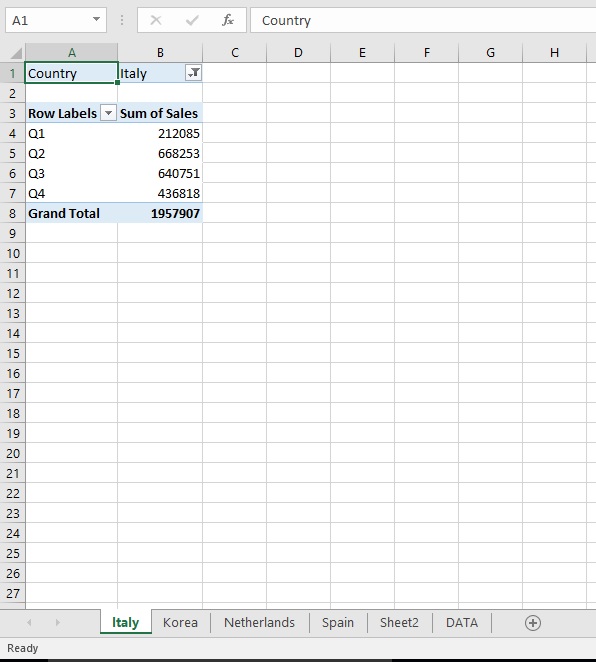
Step 17: Click on Italy tab to see Italy’s Sales for the 4Quarter’s
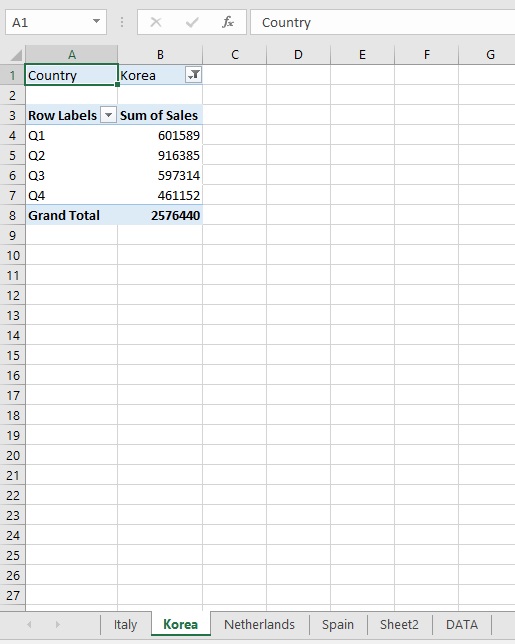
Step 18: Click on Korea tab to see Korea’s Sales for the 4 Quarter’s
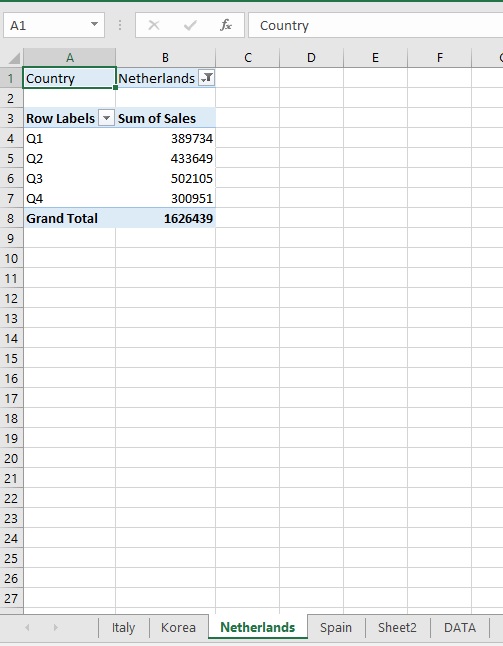
Step 19: Click on Netherlands tab to see Netherland’s Sales for the 4 Quarter’s
Step 19: Click on Spain tab to see Spain’s Sales for the 4 Quarter’s
Scope of usage
ü Can be used to automate the pivot table reports
ü Can be used to automatically create copies of the pivot table in individual worksheets
ü Can be used to automatically apply the filter on the pivot table
Can be used to report each unique value for which the pivot table is being created