Subject Line
Gantt chart is the perfect graphical tool for your project
Overview
Sometimes you may need to track the progress of the project from start to finish. A Gantt chart is a horizontal bar chart used in project management as a tool to visualize progress.
Working
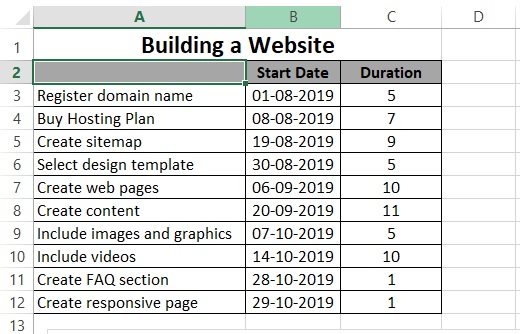
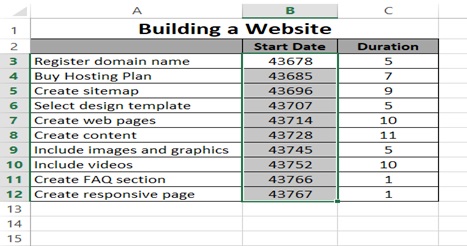
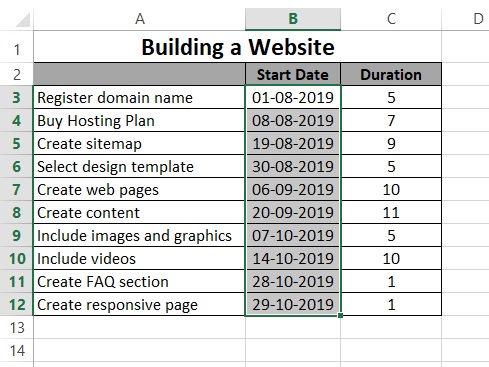
You have data below for sequential steps for building a website along with start date and no. of days required to complete.
You have to make a Gantt chart showing the progress of building the website.
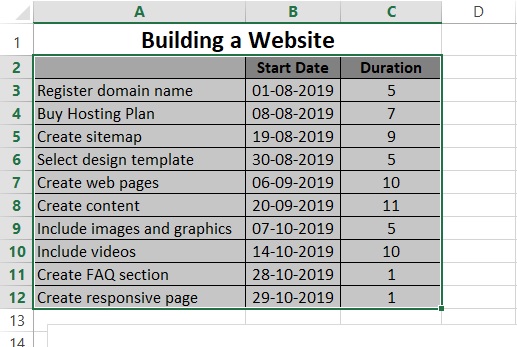
Step 1: Select the website table from A2 to C12
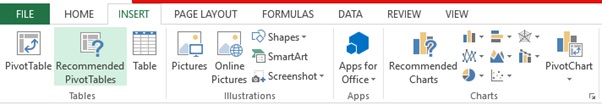
Step 2: Go to INSERT tab
Step 3: Click on Recommended Charts option
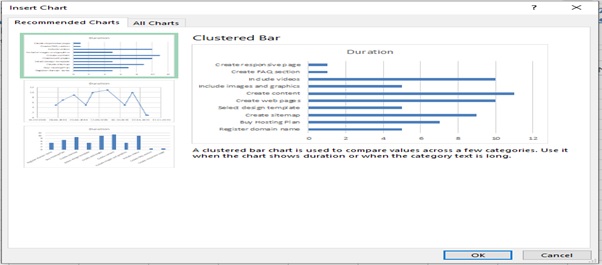
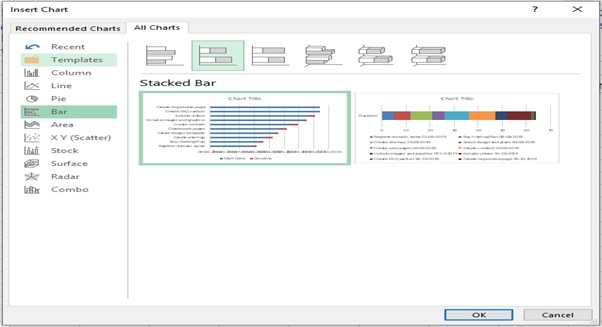
Step 4: Insert Chart dialog box appears
Step 5: Click on All Charts
Step 6: Click on Bar
Step 7: Click on Stacked Bar
Step 8: Click on OK
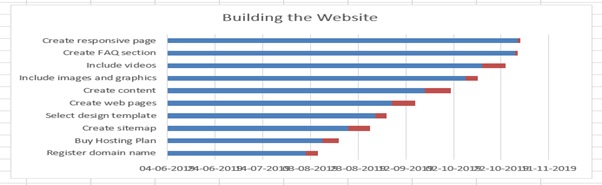
Step 9: Select the Legend and press delete button
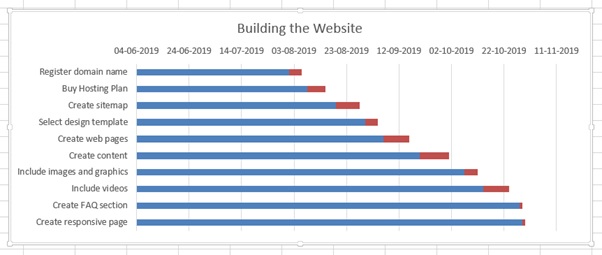
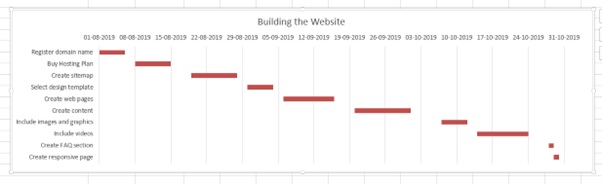
Step 10: Enter the Title “Building the Website”
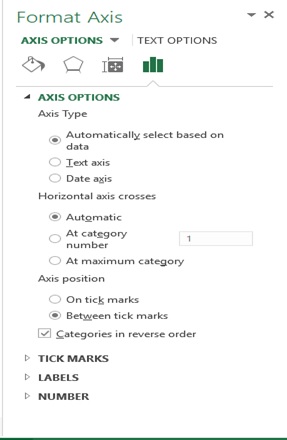
Step 11: Right click on the task on the left side of the bar and click on Format Axis…
Step 12: Format Axis option appears
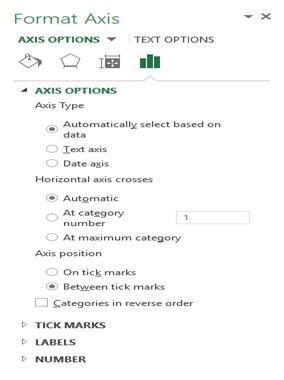
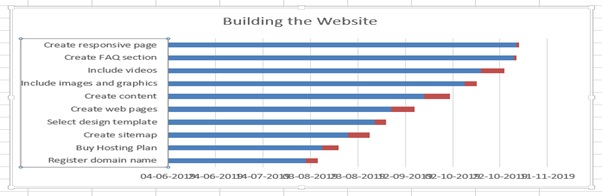
Step 13: Select Categories in reverse order tick box
Step 14: Now it reversed as per order
Step 15: Select the blue bars
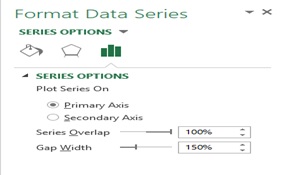
Step 16: Click on Format Data Series
Step 17: Format Data Series option appears
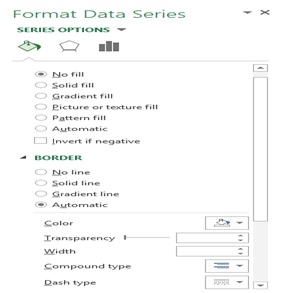
Step 18: From the Fill & Line option select No fill
Step 19: Click on Cancel button
Step 20: Select the date B3 to B12
Step 21: Go to number formatting and select the Number from dropdown.
Explanation: This is to show that Dates and Time are stored in numbers in excel and counts the number of days from January 0, 1900. From the below image we can see that minimum is 43678 & maximum is 43767.
Step 22: Select date format again for the Start date
Step 23: Right click on dates on the chart
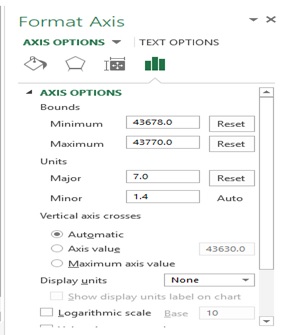
Step 24: Select Format Axis
Step 25: Type Minimum as 43678 & Maximum as 43770 in the bounds.
Step 26: Type 7.0 (week) for major units
Step 27: Click on Cancel option to close
Step 28: Final result
Scope of Usage
- Can be used as a project management tool
- Can be used to track the status of the project
- Can be used to prepare schedules
Can be used represent duration using horizontal bars